@BlueberryMacaron
·4/28/2026NQ1!SHORT5mWIN · 2065
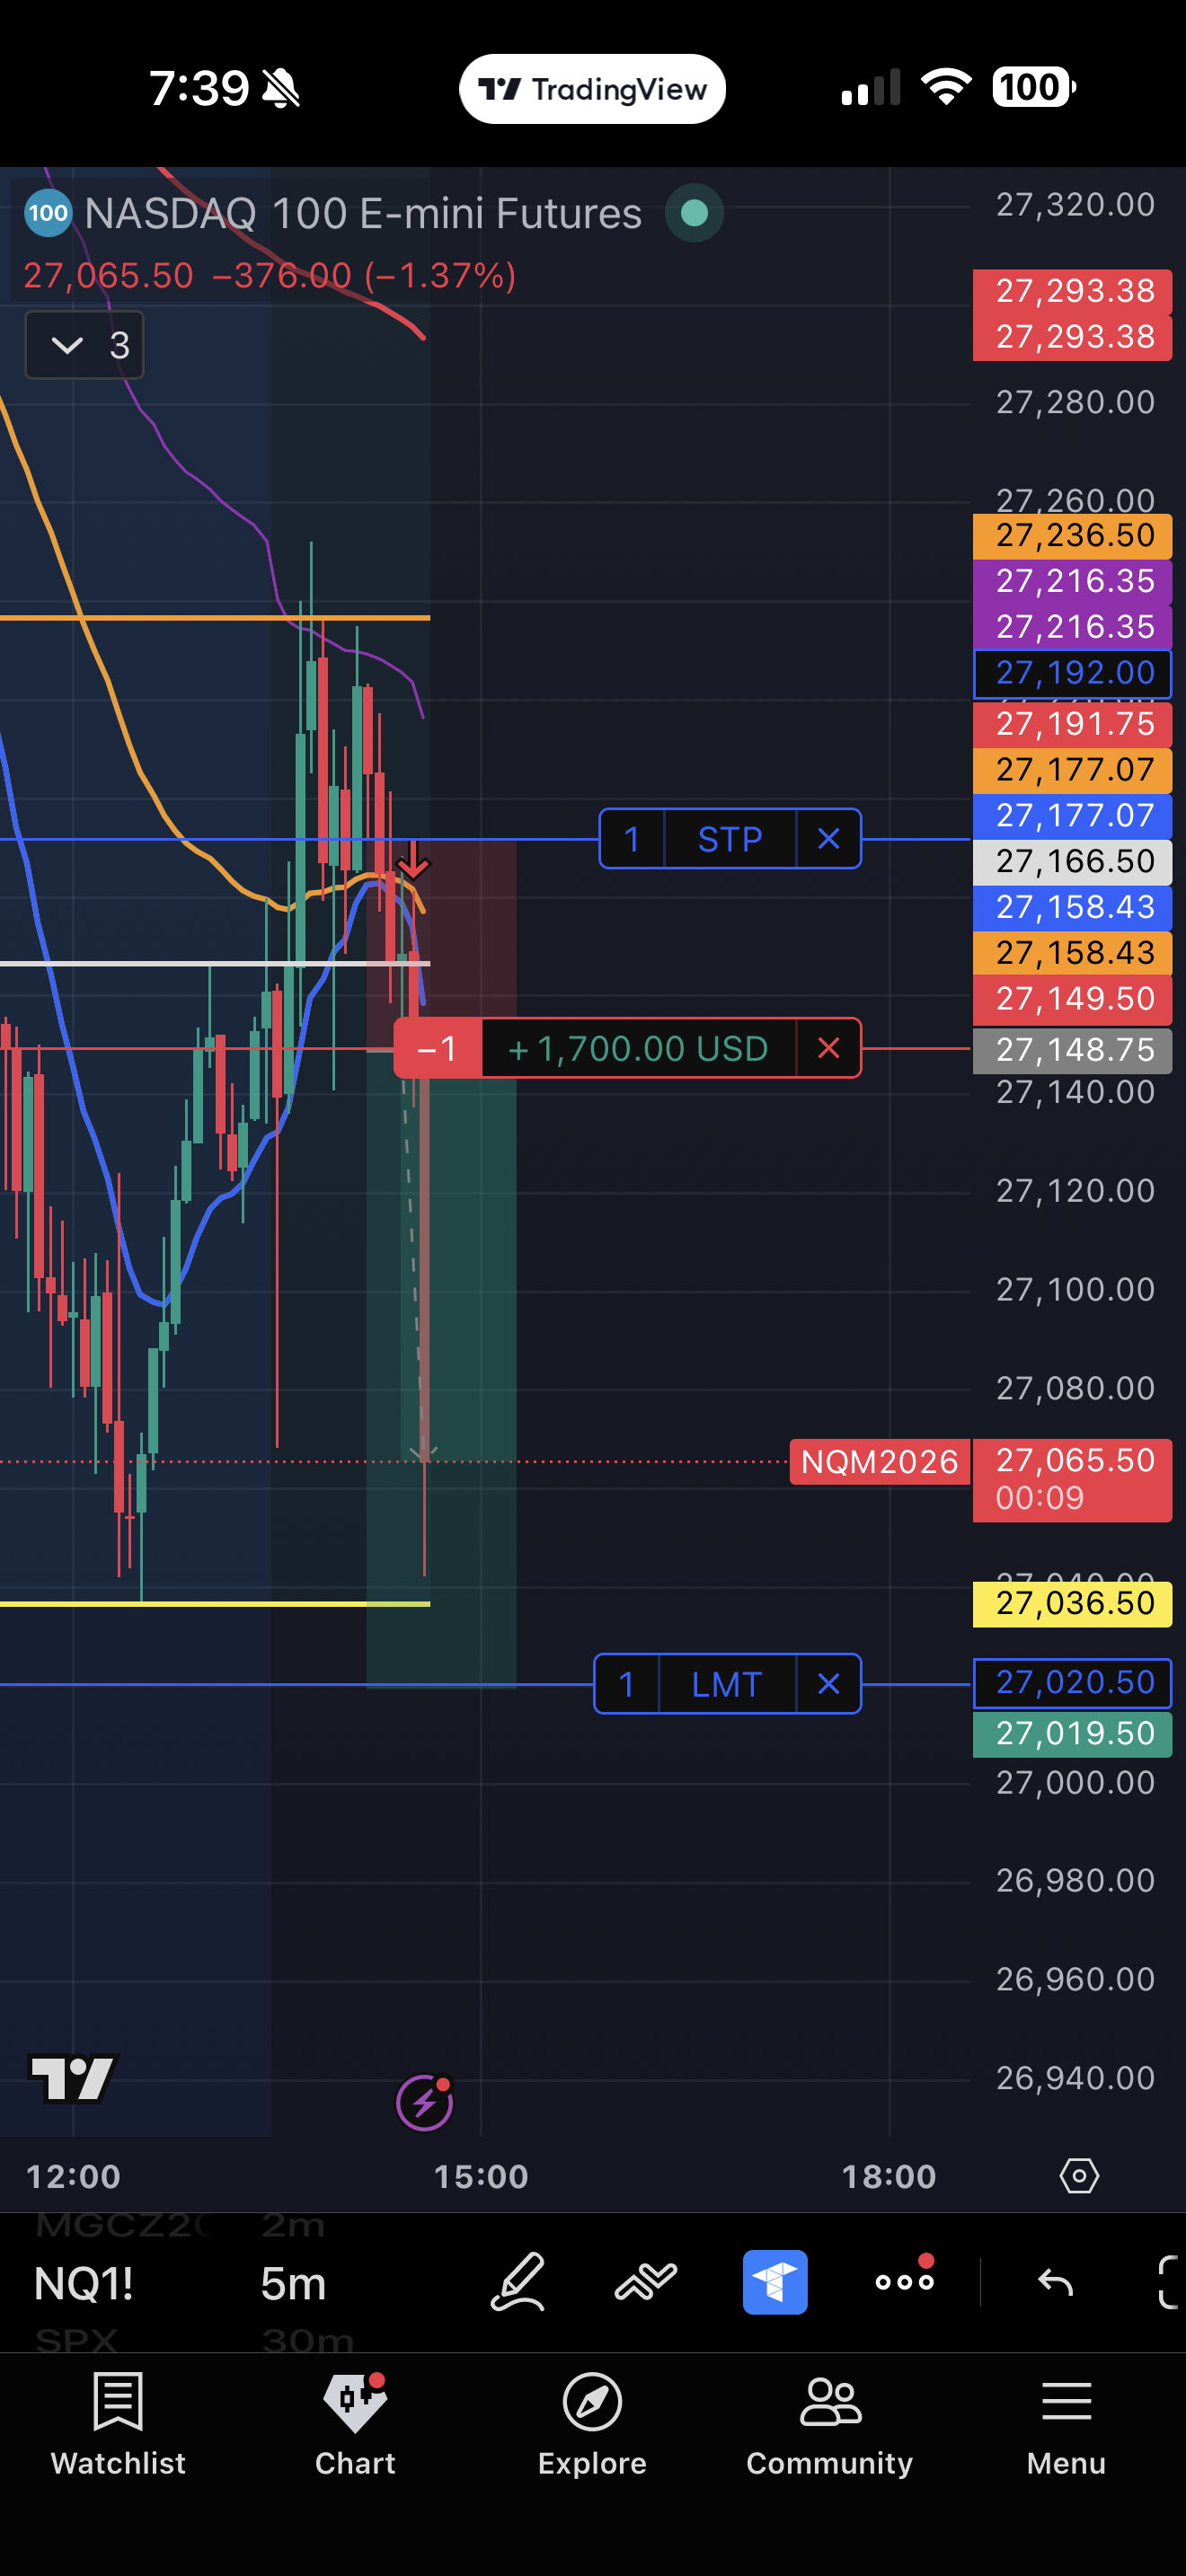
Entry
27148.75
Stop
27177.07
Target
27036.5
R:R
1:4.0
Reasoning
This is a multiple indicators strategy.
1. Confirm higher timeframe (HTF) 4hr, 1hr structure—price breaking below recent lows and moving away from EMAs, lower timeframe shown an EMA crossover signaling bearish momentum.
2. Identify a 15-min supply zone (27251–27141) and enter on the break after a tap into the zone.
3. On the 5-min timeframe, note resistance at 27250 with a double top, followed by a break-and-retest at the neckline.
Stop loss placed above the previous candle of the entry candle.
AI Analysis
Strong multi-timeframe confluence with clear structural reasoning: HTF bias (4h/1h) confirms bearish momentum via EMA positioning and lower lows, 15m supply zone provides entry context, and 5m double top with neckline retest gives tactical entry. Stop loss is logically placed above the entry candle, and the 1:4 R:R is excellent. Minor weakness: the entry description ('break after a tap') is slightly ambiguous—unclear if entry was on the break itself or on retest of the neckline, which affects timing precision.