@CoolPotatoGuy
·4/20/2026SPXLONG5mWIN
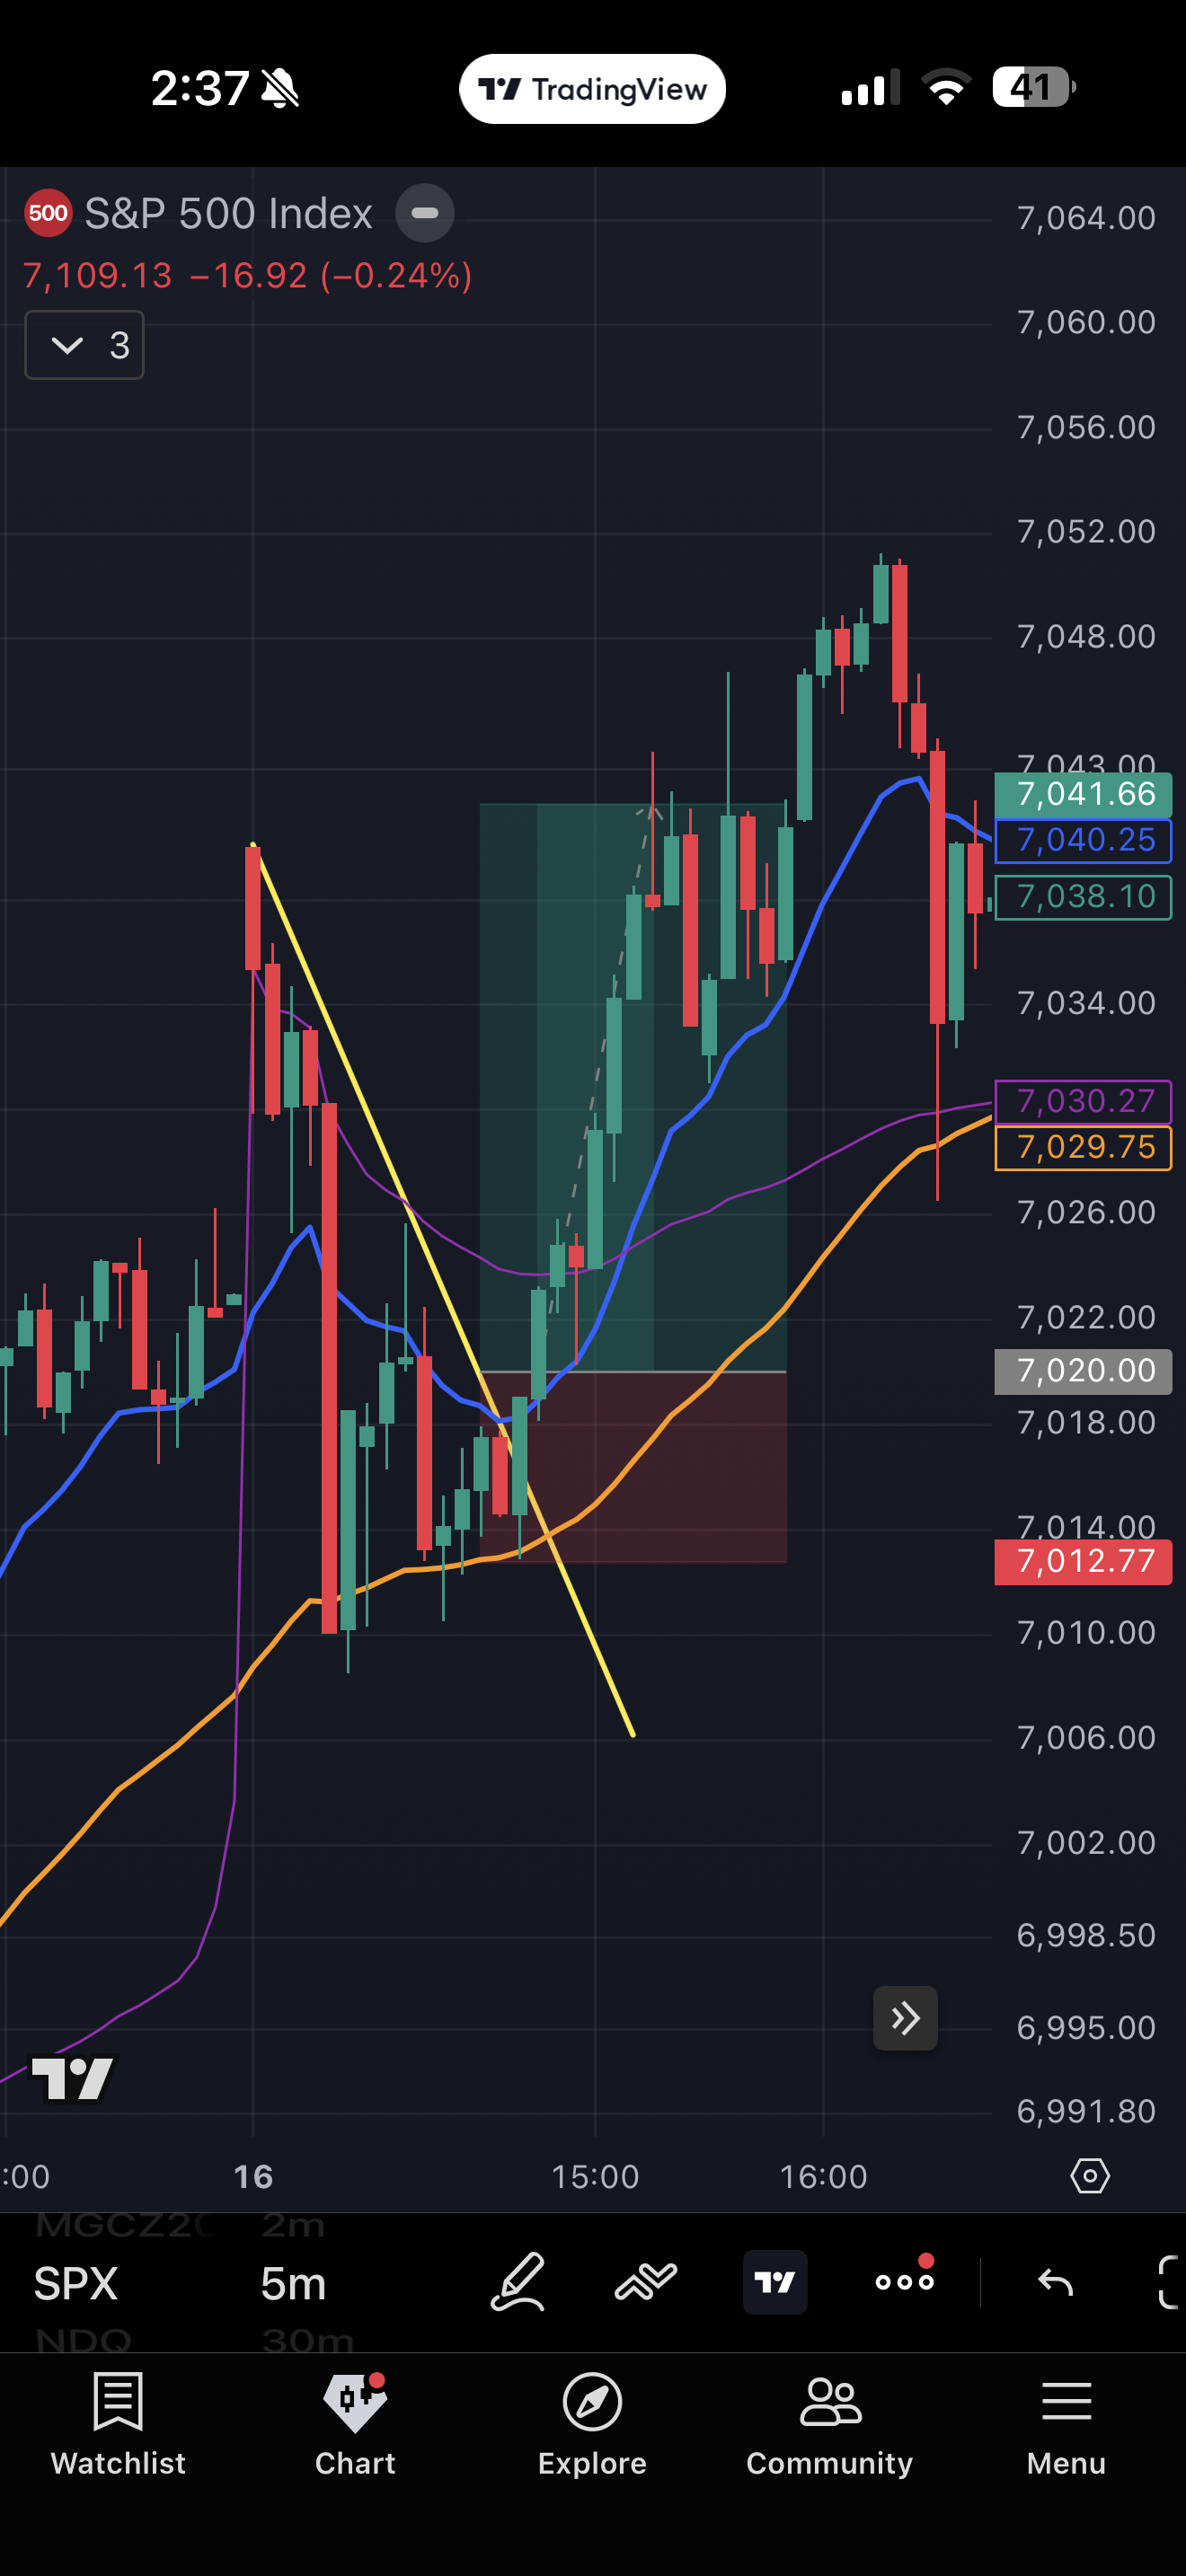
Entry
7020
Stop
7012.77
Target
7041.66
R:R
1:3.0
Reasoning
This is a trend break trade.
1. There is a confirmed break of the trendline across multiple timeframes.
2. The higher timeframe shows a bullish bias, with all candles positioned above the EMAs.
3. On the 2-minute and 5-minute charts, price has broken and successfully retested the 13 and 50 EMAs.
Stop loss set to the swing low.
AI Analysis
Strong multi-timeframe confirmation with clear trendline break, EMA alignment showing bullish bias, and successful retest on lower timeframes. Entry at 7020 after retest shows discipline. Stop at 7012.77 appears structurally sound below the retested EMAs. Excellent 1:3 R:R. Minor weakness: no mention of key structure levels or supply/demand zones that could interfere with the 7041.66 target.