@tiffanytrades
·5/15/2026YM1!SHORT1mWIN · 1680
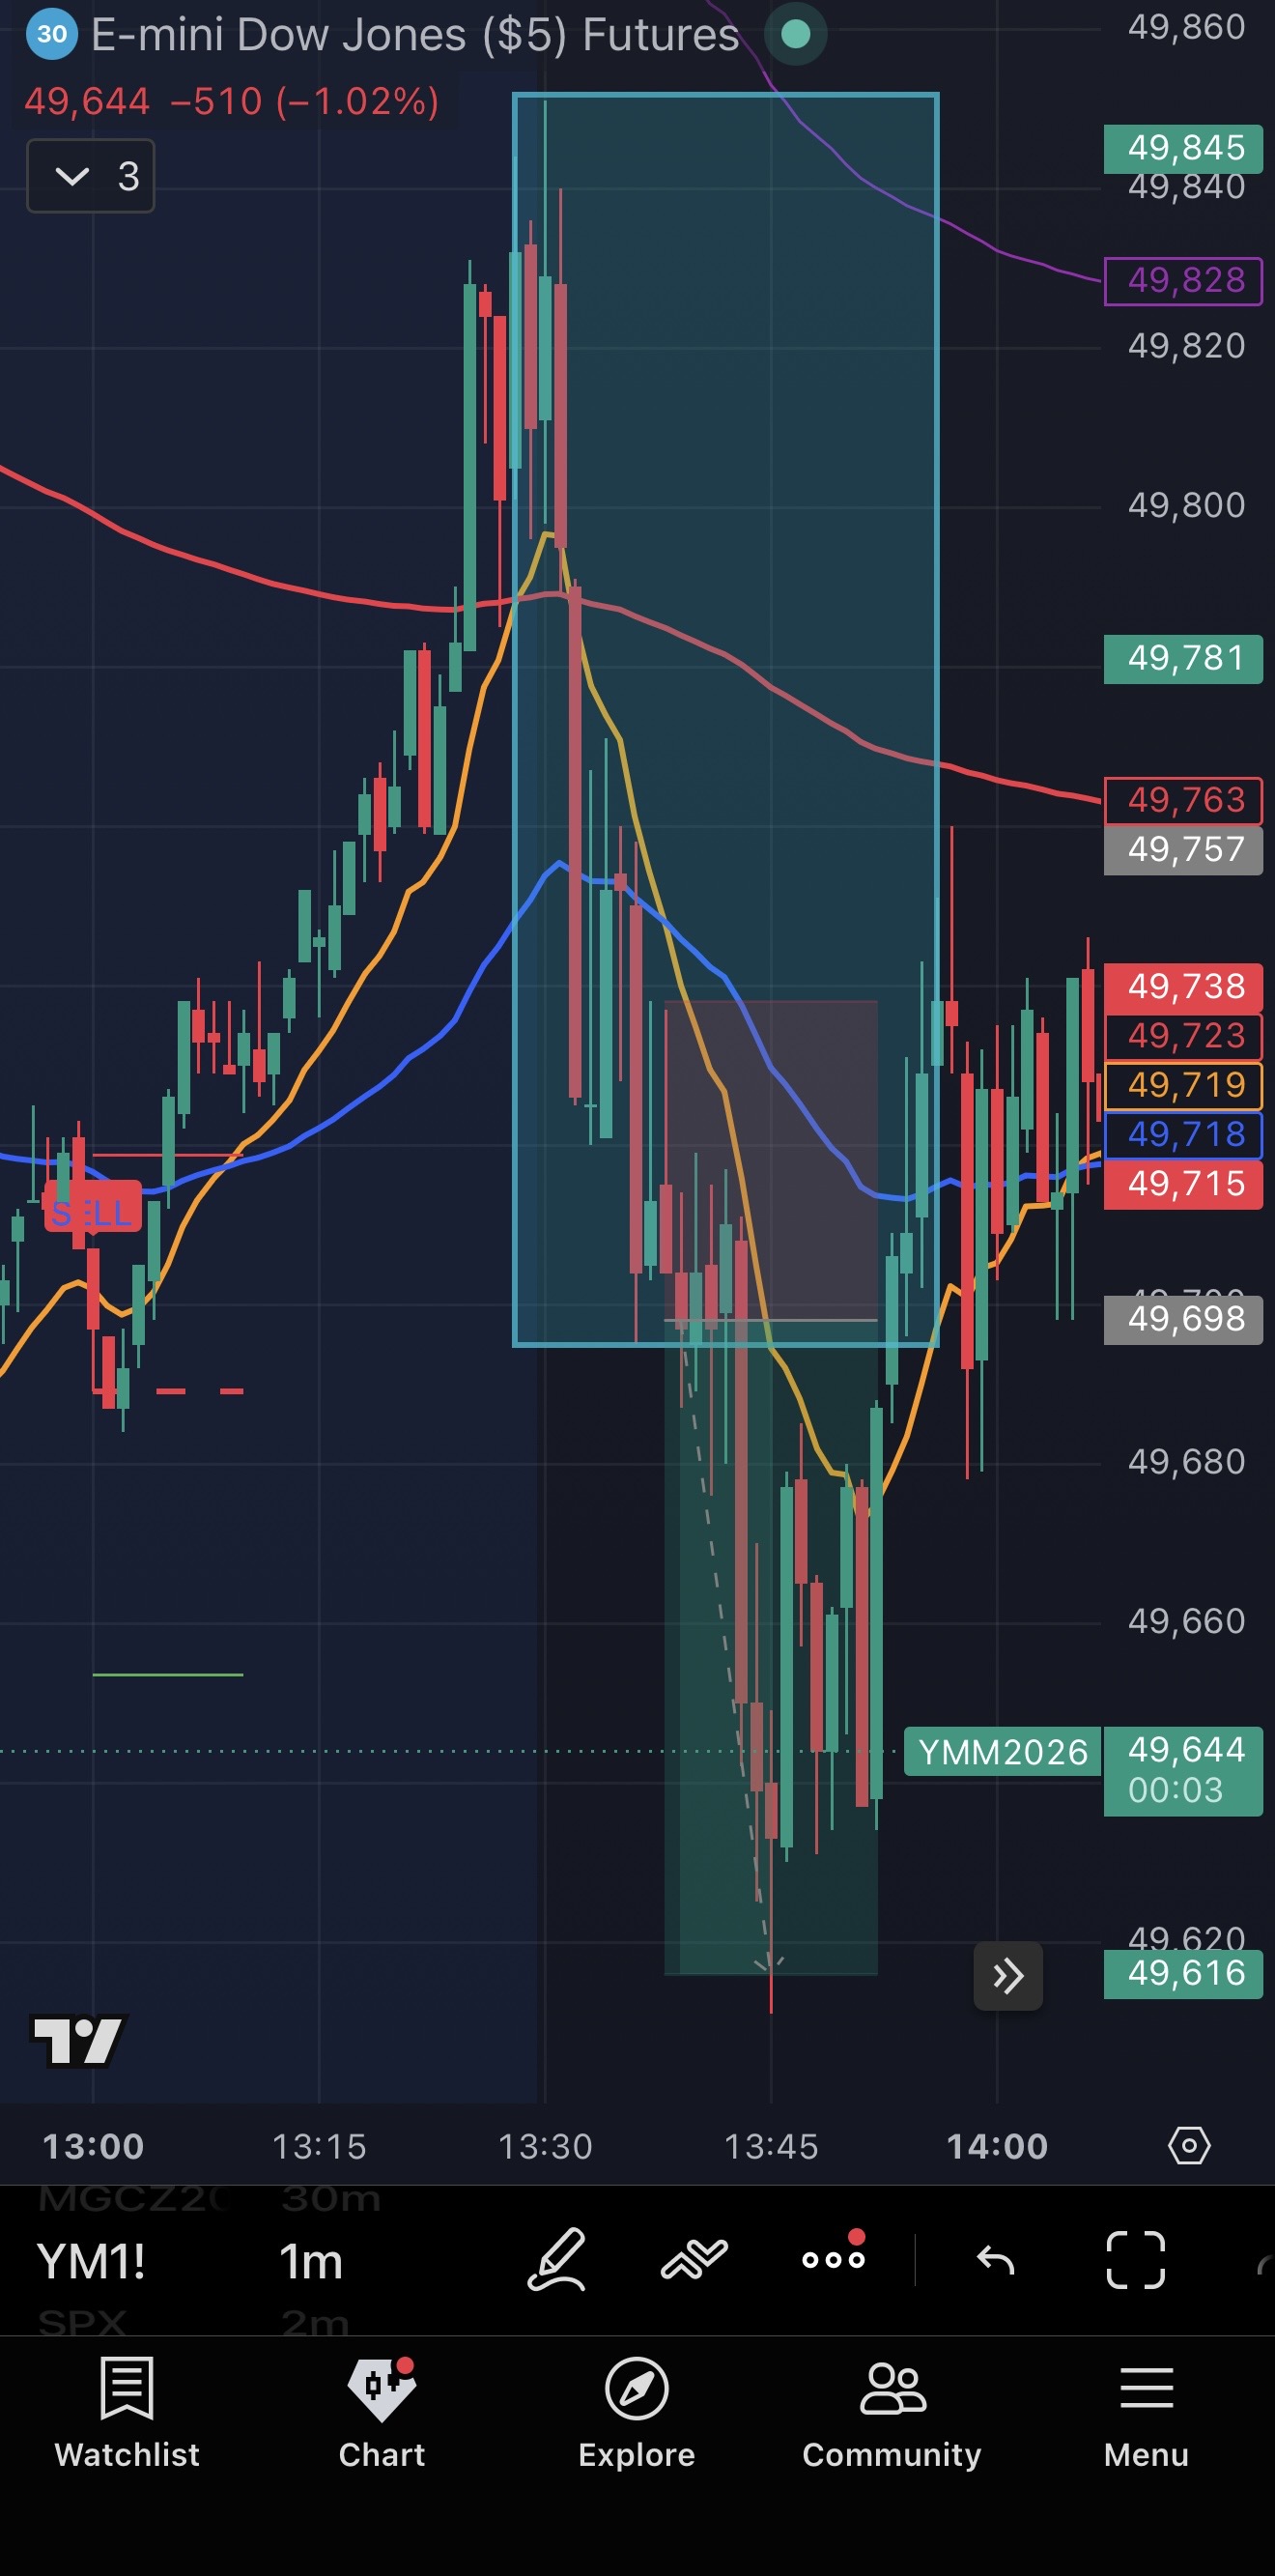
Entry
49697
Stop
49738
Target
49615
R:R
1:2.0
Reasoning
Another day, another 5 min ORD breakout trade.
Confirmed in HTF that we are on an overall downtrend, price moving below and away from EMAs. After the first 5 min of market open, price broke out of ORD range, price retested but formed an doji in the 2 min timeframe, showing more resistance to move up and held below that level and move towards the downside.
Set my stop loss above the entry candle wick.
Set my take profit at swing low, previous key level range 49610 to 49601
AI Analysis
Solid setup with clear HTF confirmation (downtrend, price below EMAs) and a logical entry trigger (ORD breakout with 2m doji rejection). Stop loss is structurally sound at the entry candle wick. R:R of 1:2.0 is excellent. The main weakness is that the trader didn't explicitly confirm the ORD range itself or acknowledge the tight 1m timeframe risk — 41 points of risk on a 1m chart is reasonable but vulnerable to noise, and no mention of market structure confirmation at the exact entry level.