@tiffanytrades
·5/13/2026YM1!LONG2mWIN
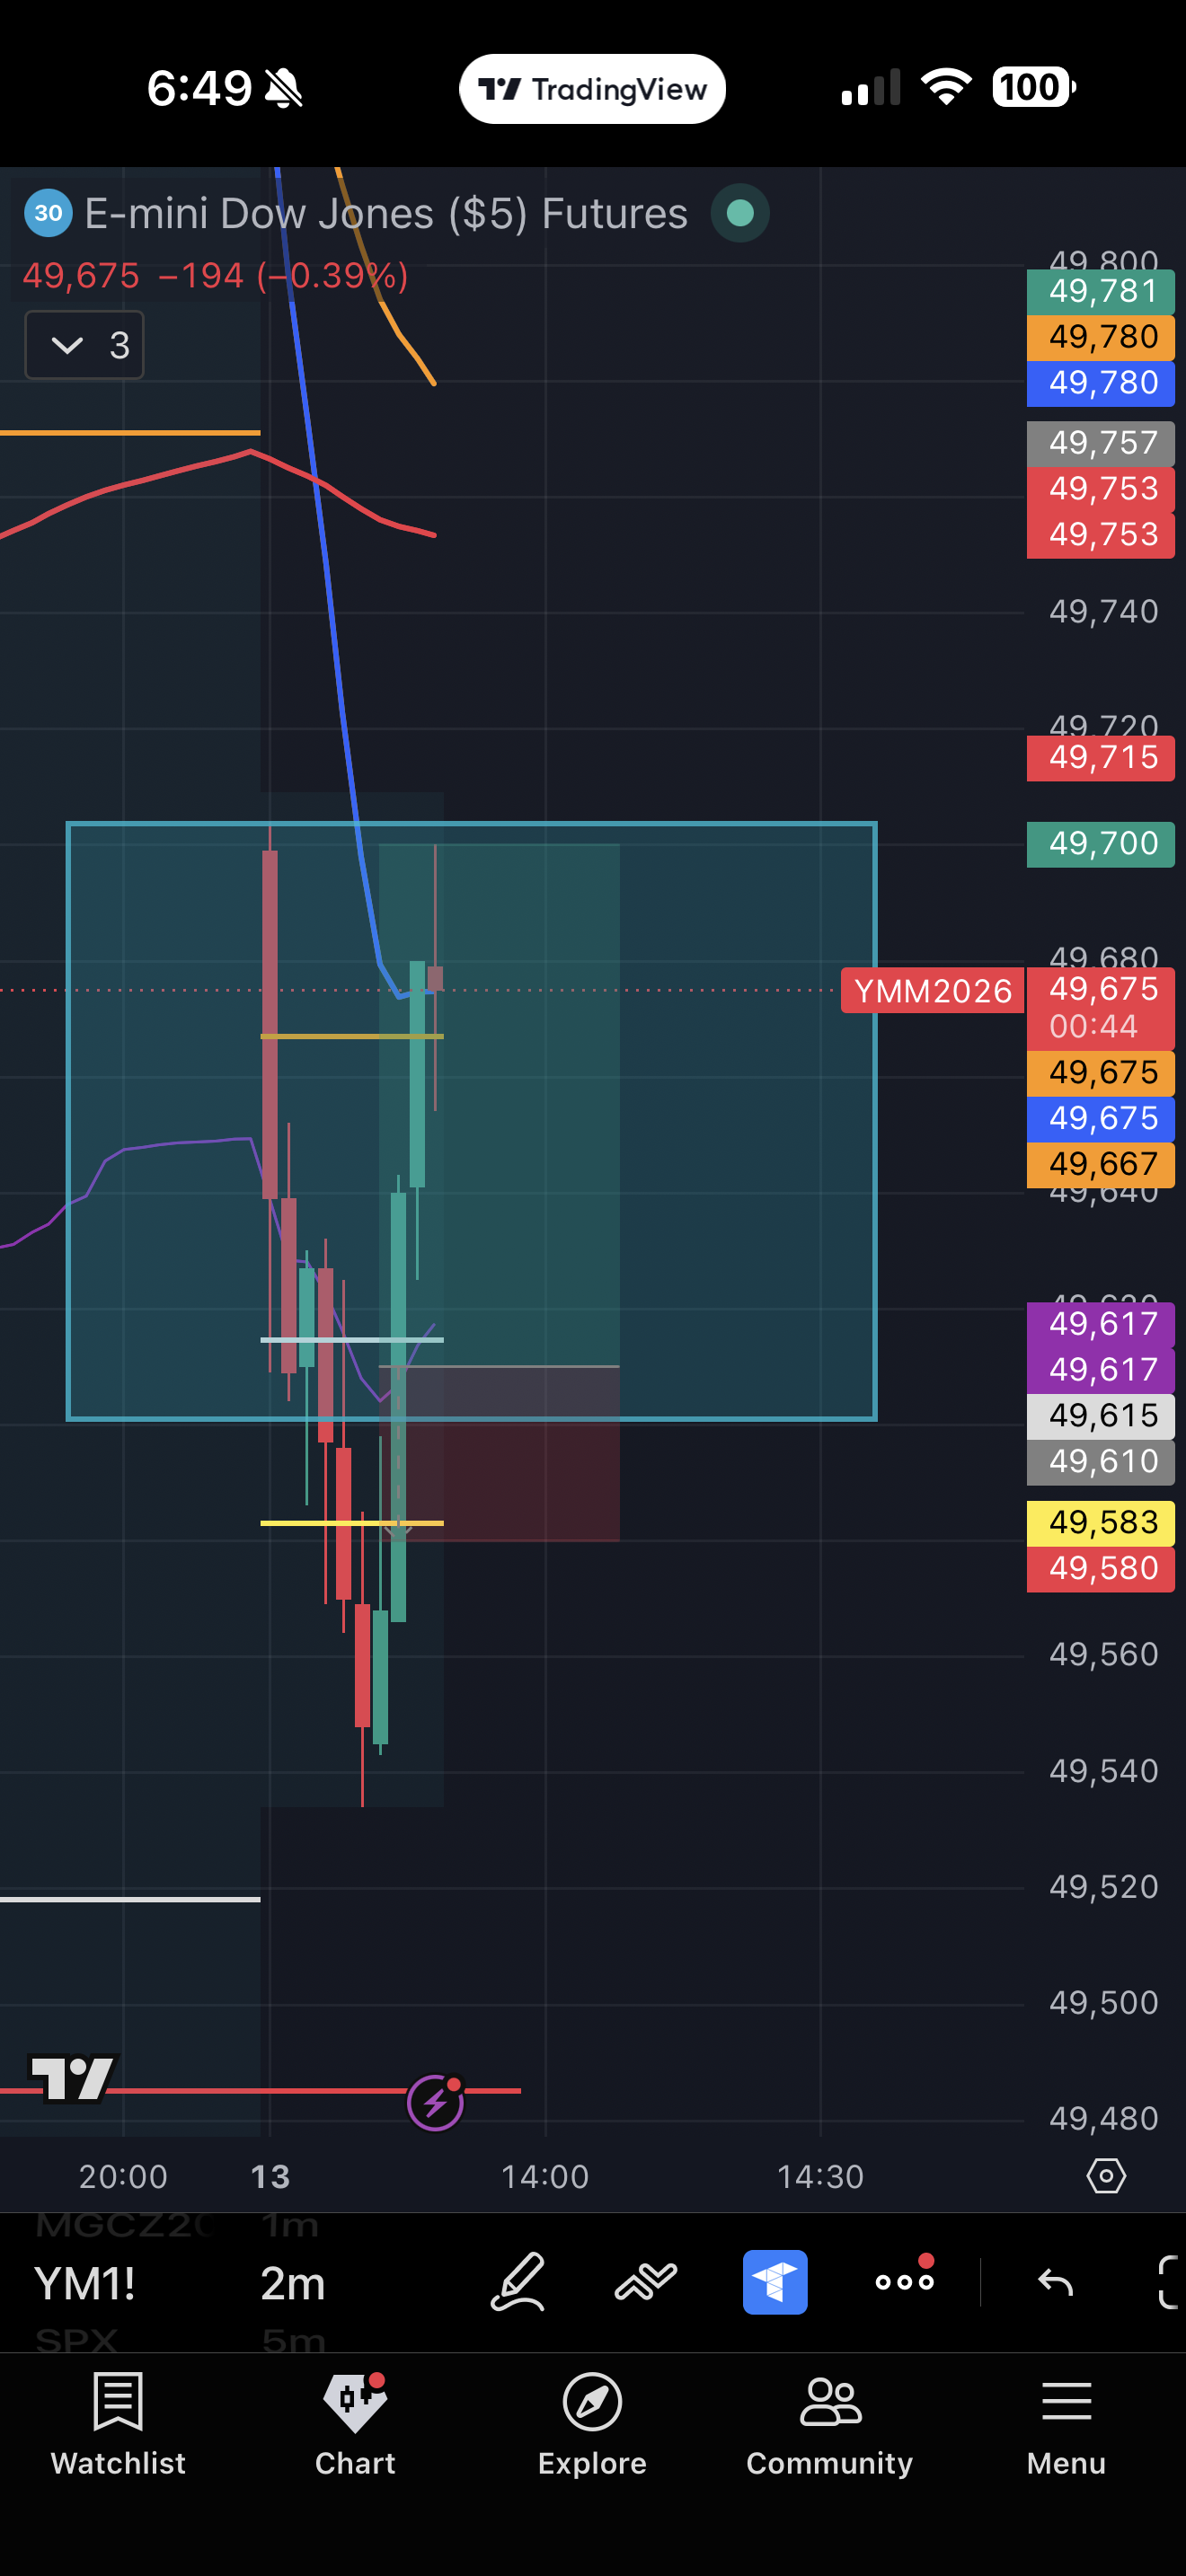
Entry
49617
Stop
49580
Target
49691
R:R
1:2.0
Reasoning
5 minute ORB failed to break out and reversed back into zone. Confirmed at HTF that it’s moving away from the EMAs. Saw resistance to go down at 49514 range. Entered at the break of the reversal candle. Gap was also created and getting filled in this trade It was a strong momentum candle so I set stop loss half way as that’s the loss I can afford. Take profit at the other up side end of the range.
AI Analysis
The trade has a valid directional bias (5m ORB reversal + HTF confirmation away from EMAs) and solid 1:2 R:R, but the stop loss placement is problematic. The trader explicitly states the SL is set at 'half way as that's the loss I can afford' — this is risk management driven, not structure-driven. A 37-point stop on a 2m chart is tight and vulnerable to noise, especially if it doesn't align with a structural level. The entry logic (break of reversal candle) is sound, but without clarity on where that candle actually reversed or what specific level defines it, the setup feels somewhat discretionary. The gap-fill and range extremes are reasonable TP anchors.