@tiffanytrades
·5/7/2026YM1!SHORT1mWIN
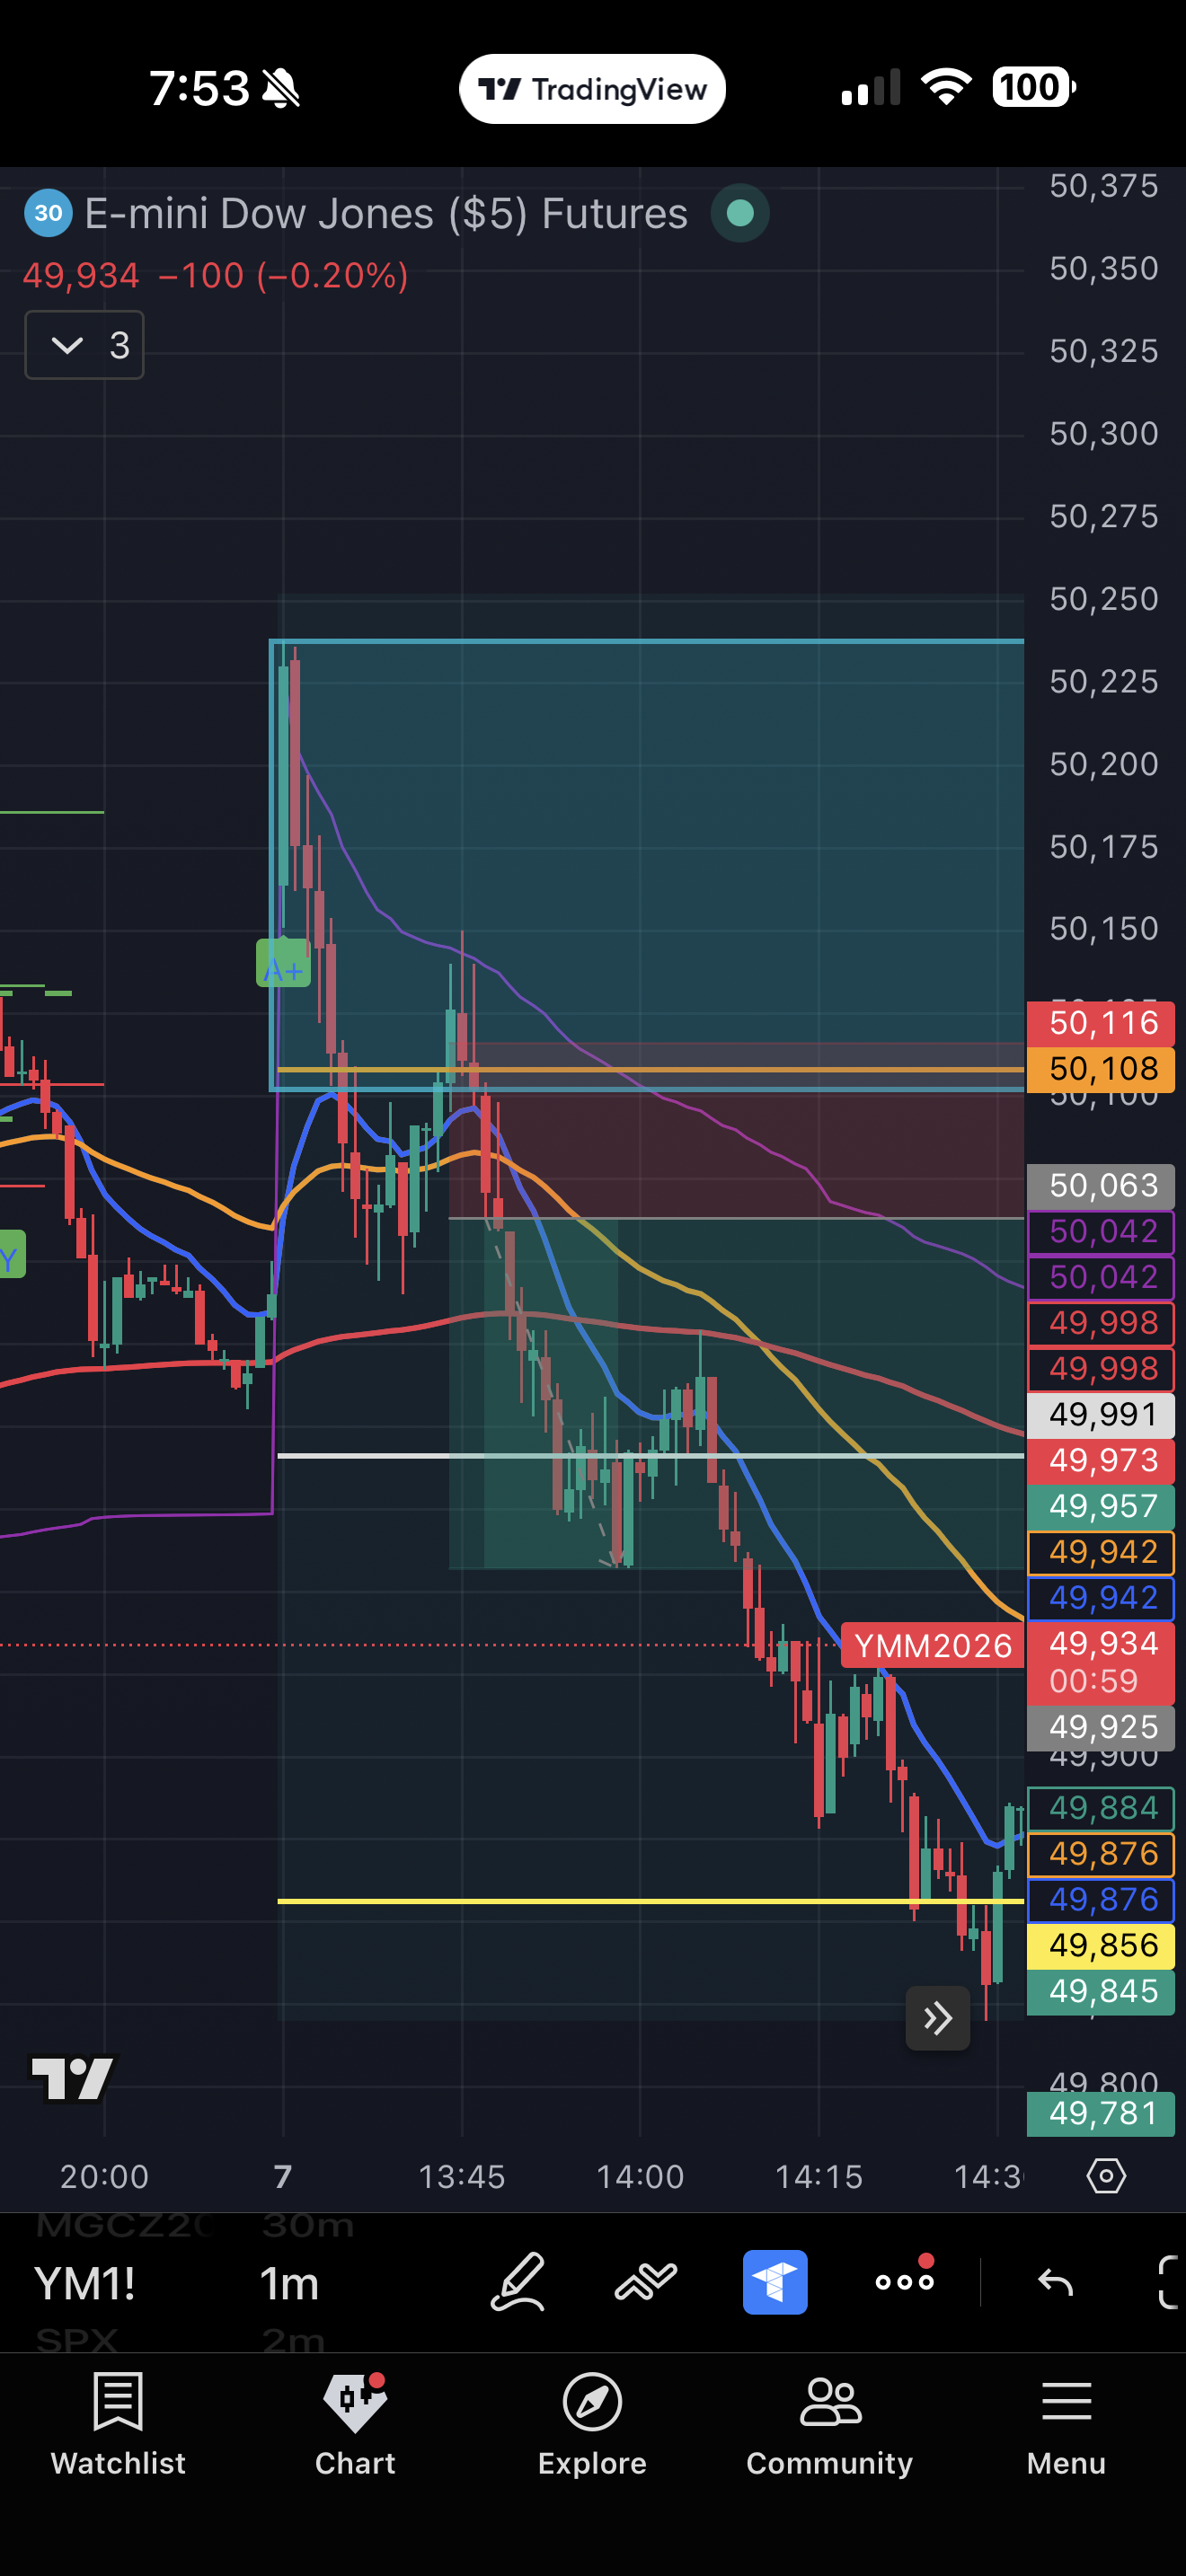
Entry
50063
Stop
50116
Target
49958
R:R
1:2.0
Reasoning
5 minute ORB breakout trade: Strong resistance was identified at the ATH zone between 50,234–50,180, confirmed on the higher time frame. Price showed candles breaking below the 13 EMA across multiple timeframes, signaling weakness. The candle then broke out of the ORB range, retested, and continued moving lower to the downside.
I waited for the candle after it retested to confirm it’s really move downside before entering.
Set stop loss above the candle prior to the entry candle.
AI Analysis
Solid setup with clear confluence: ATH resistance zone identified on HTF, EMA breakdown across multiple timeframes, and ORB breakout with retest confirmation. Entry timing is disciplined (waited for post-retest candle). However, the stop loss placement is vague—'above the candle prior to entry' lacks a specific structural level, and at 53 pips it's moderately wide for a 1m scalp. The 1:2 R:R is excellent and the directional bias is well-reasoned, but the trade would be stronger with explicit reference to a key structural level (swing high, ORB high, etc.) for the stop.