@BlueberryMacaron
·4/20/2026YM1!SHORT2mLOSS
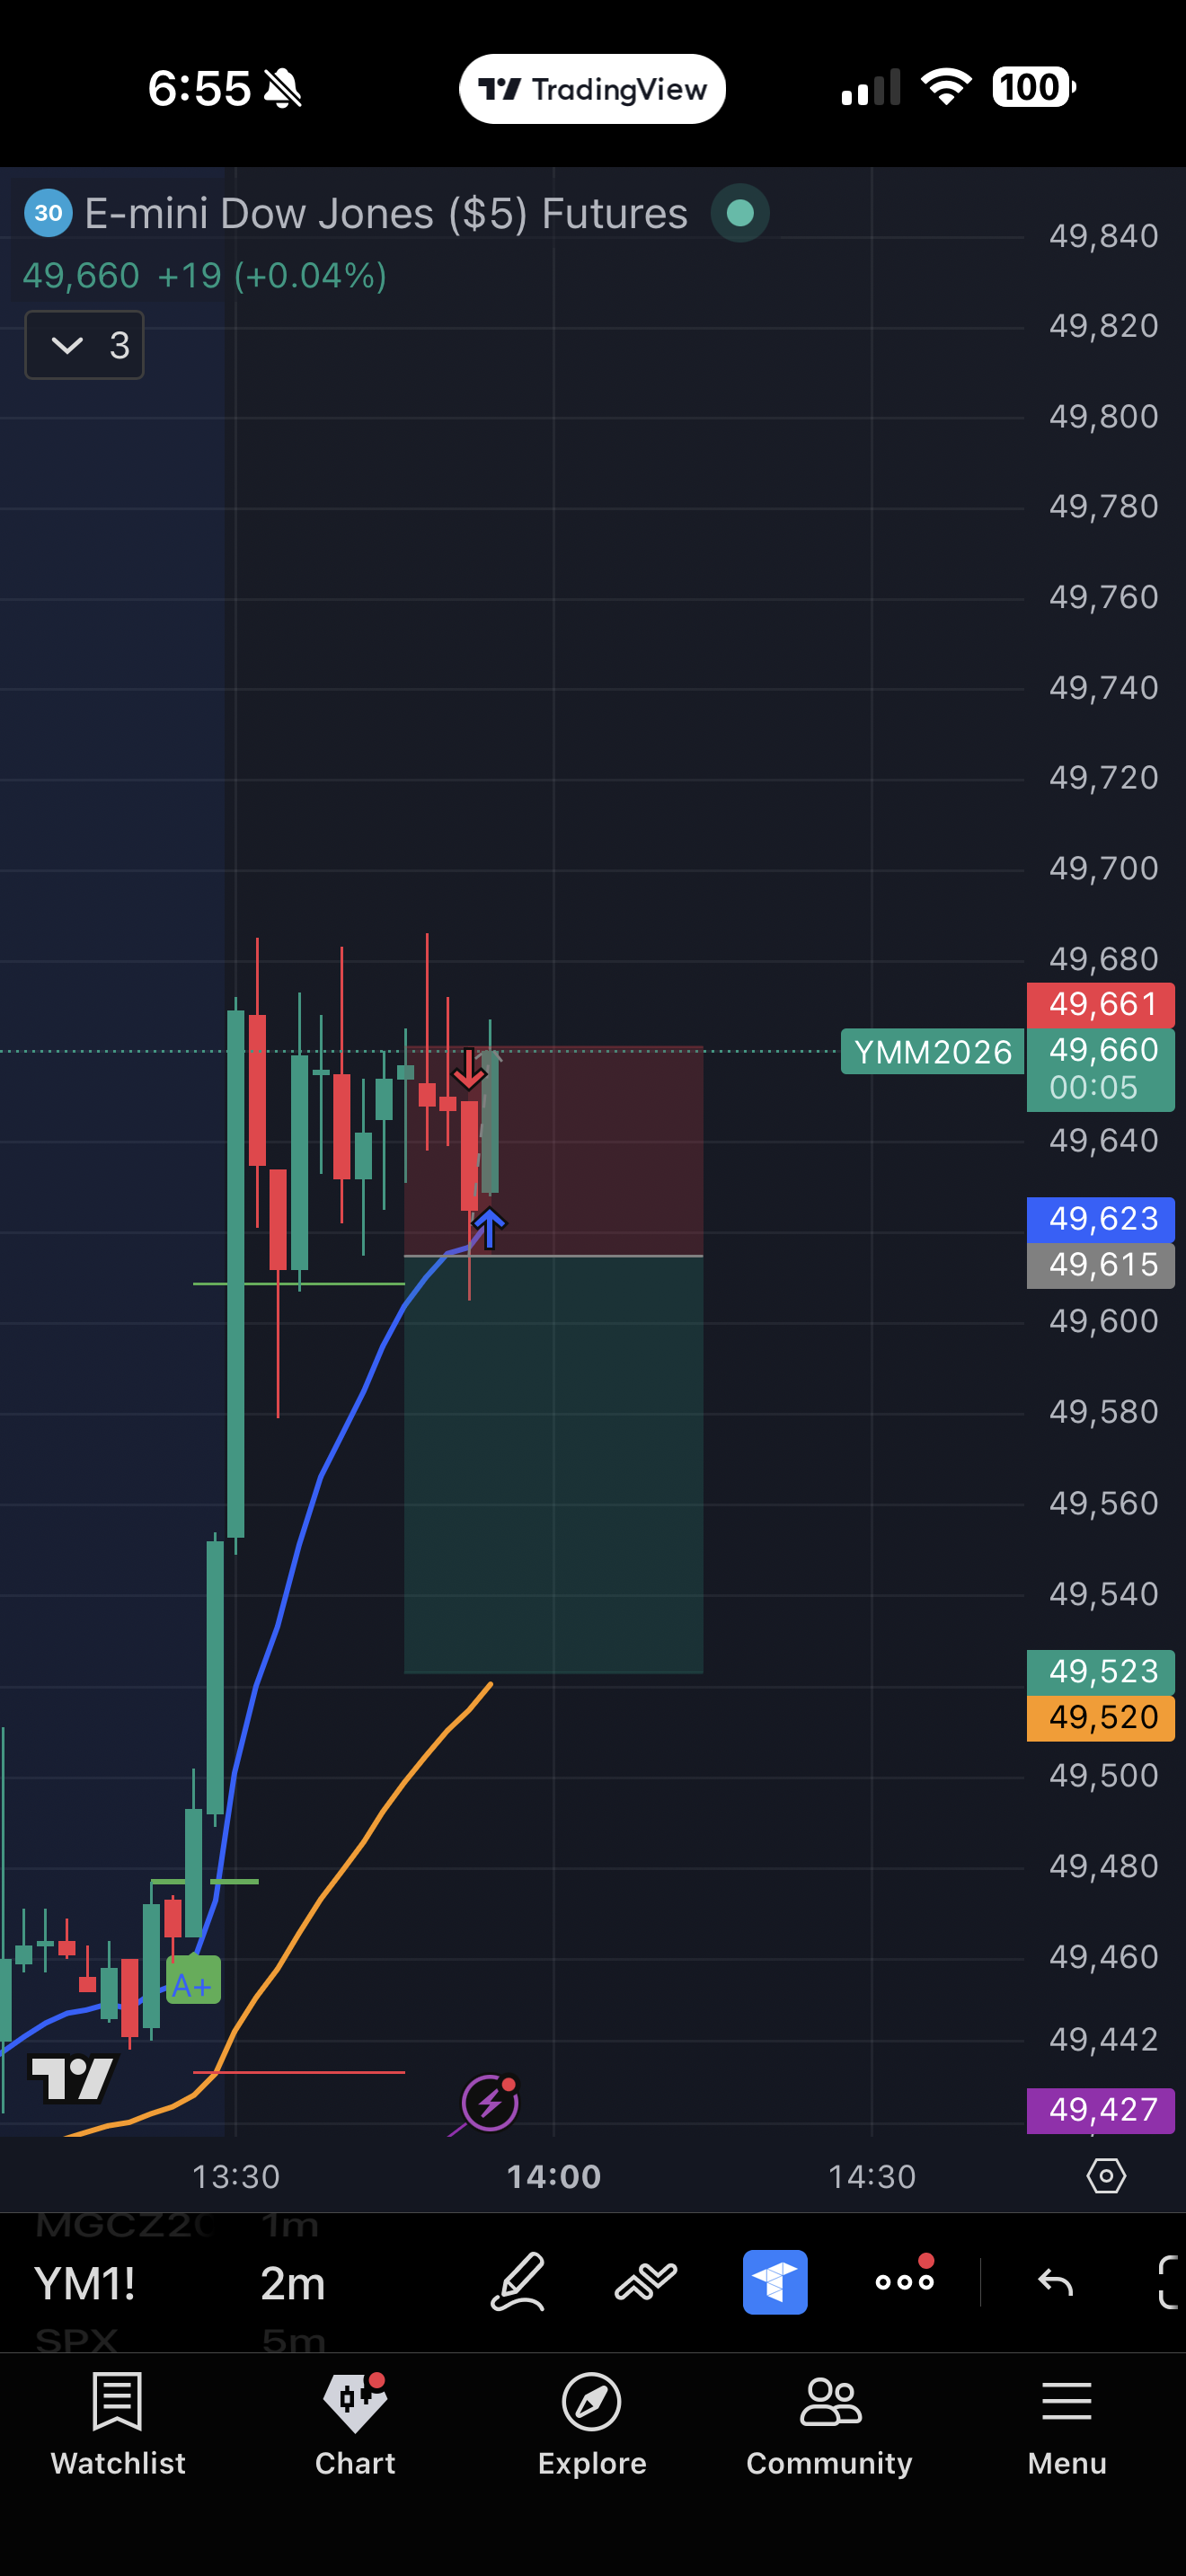
Entry
49615
Stop
49660
Target
49523
R:R
1:2.0
Reasoning
1. HTF doesn’t show much but candles about EMAs.
2. Candles shows strong resistance at the 49680 level.
3. Market structure shows triple top candle pattern which indicate a signs of reversals
4. Large gaps between 49500 to 49580 which indicate imbalance of the sell side and potential for gap to be filled.
5. Set my entry at the break of EMA 13 towards the downside.
Too tight of a stop loss I guess.
AI Analysis
Valid counter-trend reversal setup with multiple confluence points (triple top, resistance, imbalance gap, EMA break), but critically weakened by stop loss placement that doesn't respect the identified resistance structure at 49680. Trader shows good awareness of imbalance concepts and pattern recognition, but undermines the setup by placing SL 20 points below the key resistance level they identified.