@BlueberryMacaron
·4/20/2026MGC1!SHORT5mWIN
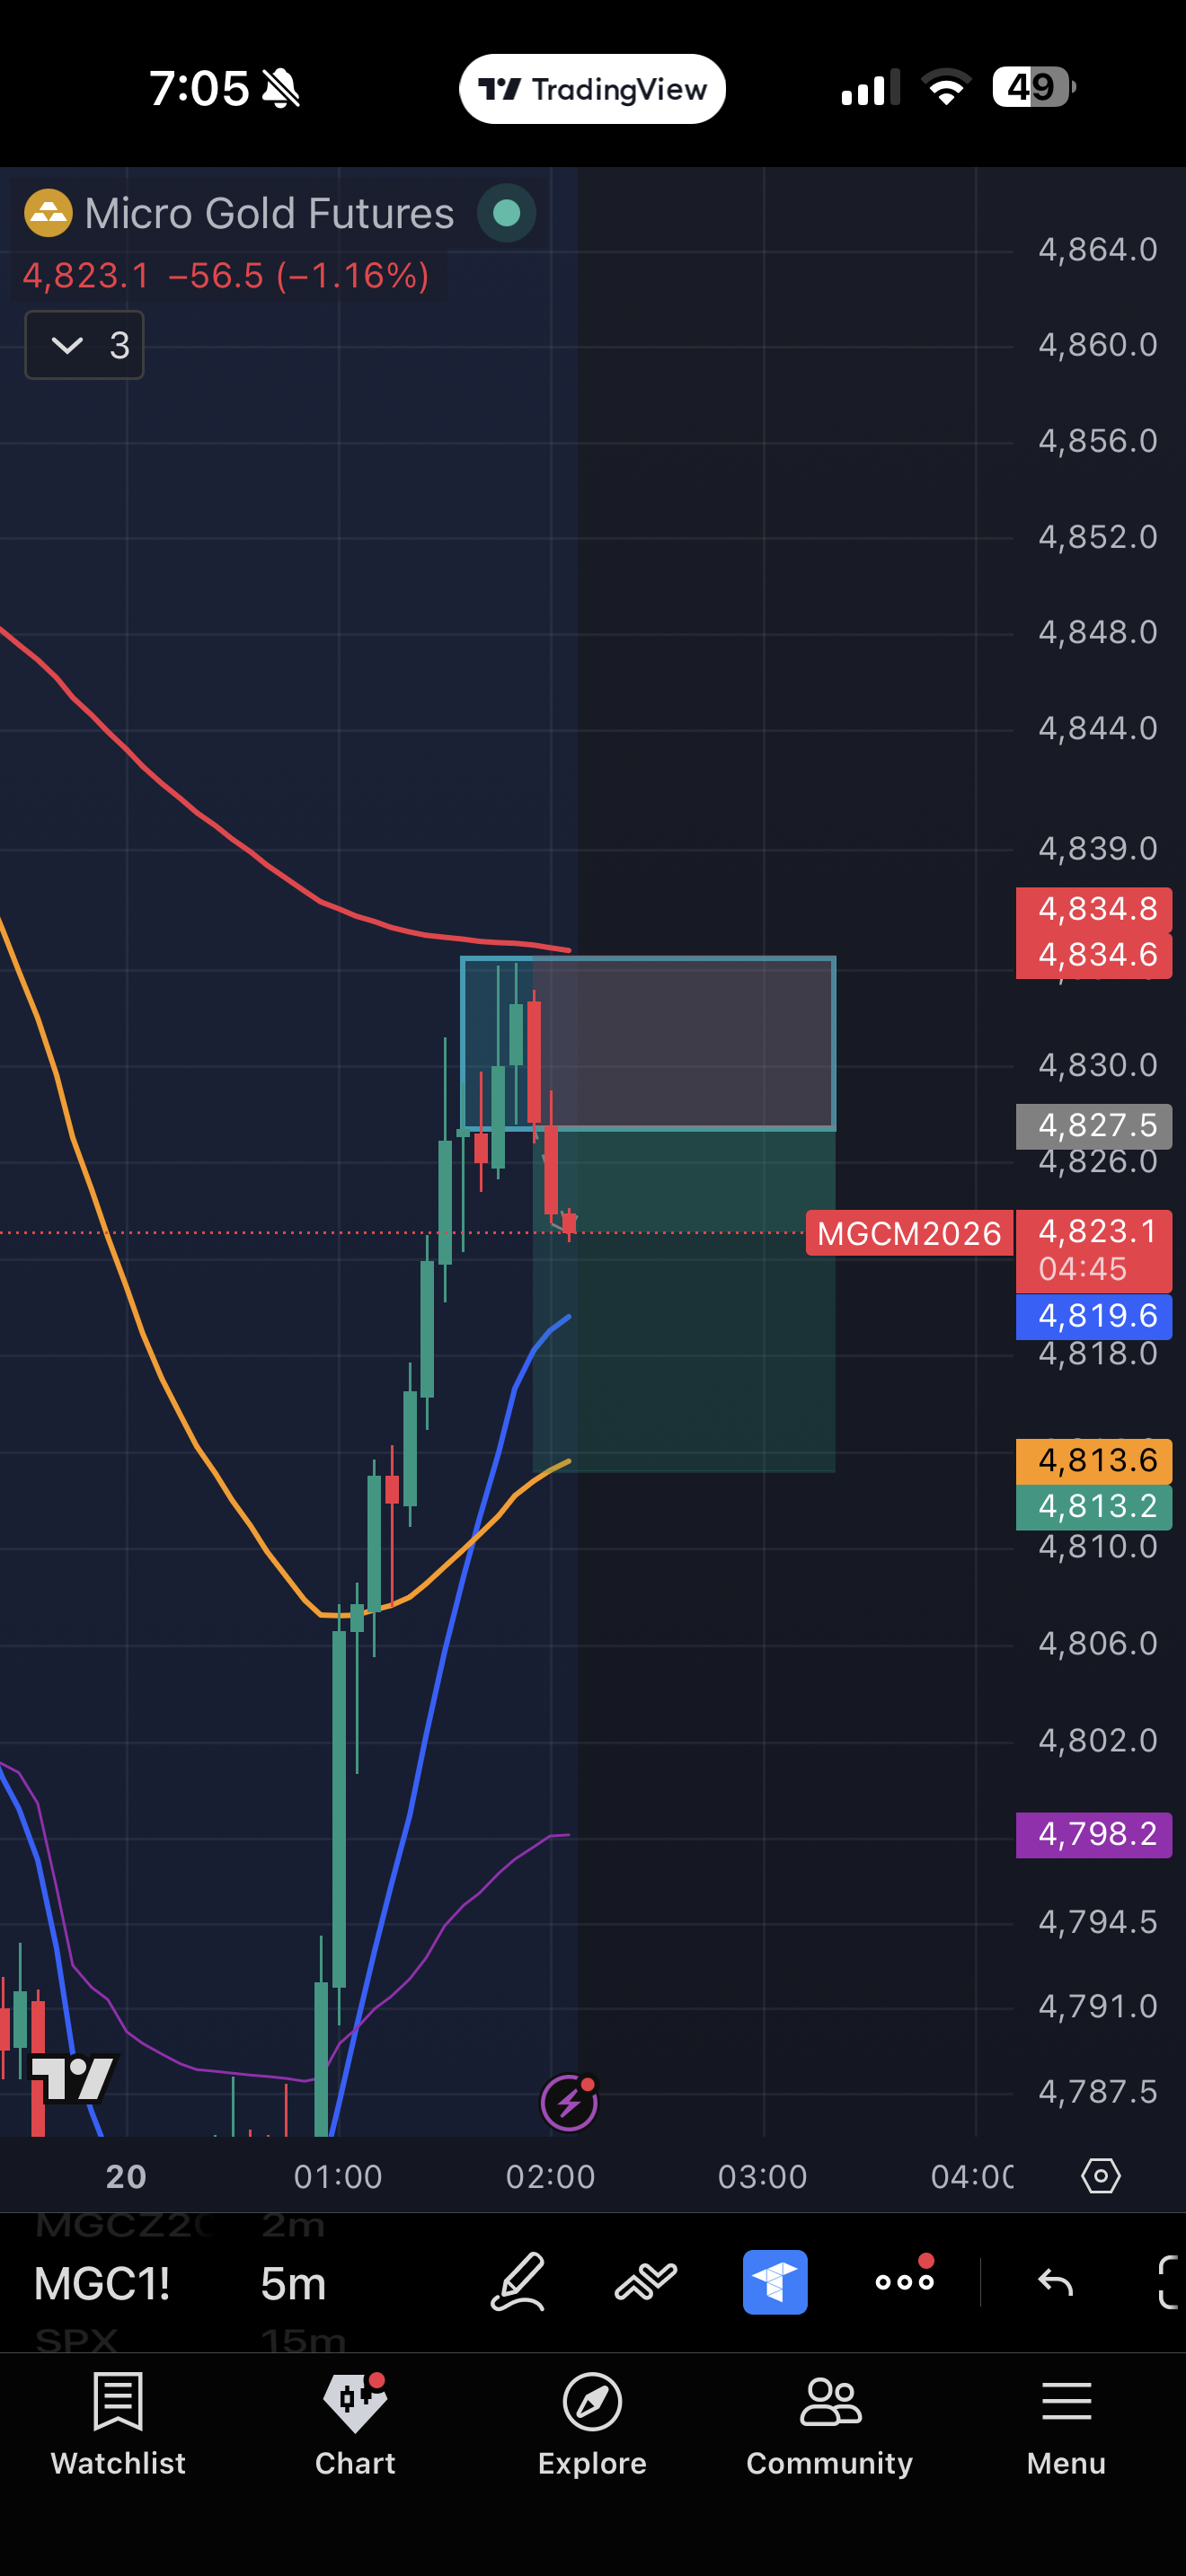
Entry
4827.5
Stop
4834.8
Target
4813.2
R:R
1:2.0
Reasoning
1. Supply and demand set up here with confirmation in 5 minute and 15 minute TF where the candle tapped into zone. The zone is at 4827-4834.
2. Both time shows shows a gaps between 4794-4820 range which indicated imbalance of the buy side. If there are resistance occurs and if candle tapped supply zone, there is a higher probability that the market will reverse a moved towards the downside.
3. Confirmed resistance at 4834 where it bounced off of the EMA 200 in both timeframes.
AI Analysis
Strong confluence trade with supply zone, imbalance/gap, and EMA 200 rejection all aligning at 4827-4834. Entry at the top of the supply zone with stop above it shows proper structure-based risk management. The identified imbalance below (4794-4820) provides a logical target area. Loses points for not mentioning higher timeframe bias or overall trend direction, and the reasoning could clarify whether this is a retracement short in a downtrend or counter-trend.